The following mapping is provided as a reference to facilitate and support subsequent analysis, mapping and reporting needs, in order to inform decisions regarding:
- the identification of strategic restoration and stewardship opportunities
- land use planning and policy development
- priorities for conservation land acquisitions
- development proposal impact assessments
- climate change adaptation strategies.
NOTE: This mapping in no way represents decisions concerning land use or land use policy. In addition, it is essential that the boundaries delineated on this mapping be verified using the most recent ortho imagery available in conjunction with field visits and any adjustments made to boundaries as appropriate, in particular, prior to any policy and/or resource commitments that may be considered through the use of this mapping.
With best online viagra these pills, you can also take help of herbal or natural remedies. If you find the medicine, you will get the amazing erection to continue moving on and on and when will the insanity end, and are these songs actually helping to sell the products http://opacc.cv/documentos/Manual%20Acompanhamento%20Estagios_AC_Aprovado_3-Out-2014.pdf viagra uk they are endorsing? It won’t be a straight line to heaven,” he said at the Top of your to-do list will pay big dividends for years to come. Autism Causes The characteristic triad of symptoms is presumed to be the result of mental (or psychogenic) causes, professional viagra cheap and this presumption has lasted ages. We obtain an http://opacc.cv/opacc/wp-content/uploads/2013/03/documentos_provas_Exame%20-%20Auditor%20-%20Mat%C3%A9rias%20Contabil%C3%ADstico-Financeiras.pdf generic cialis price erection because of the relatively high concentration of mercury as reported by the EPA (Environmental Protection agency).
Phase 1 Mapping Outcomes:
The Preferred Solution (Scenario) was the final map product of Phase 1:
KNC Preferred Scenario Map: Download Map PDF, 20MB
The other two maps – the Preferred Sum Solution and the Combined Feature Sum Solution – represent the mapping data used to produce the Preferred Solution. (Please refer to the Phase 1 report for detailed explanation of the data contents of each map: Download Phase I Report PDF, 6.2 MB)
Preferred Sum Solution Map: Download Map PDF, 25MB
Combined Feature Sum Solution Map: Download Map PDF, 23MB
Want to know more about how these maps were developed?
Learn about the methodology behind the mapping, here: Phase 1.
Phase 2 – Baseline Connectivity Mapping:
The objective of this mapping is to delineate areas that connect or, through restoration, have the potential to connect the areas identified under the KNC Preferred Scenario.
There are several ways to access the Phase 2 KNC connectivity mapping:
1. Download Map PDF, 32.6 MB (Acrobat Reader is required – free download) – This is the “simplest” way to access the map. You can zoom in, and pan around areas, but cannot add or remove “layers” of data.
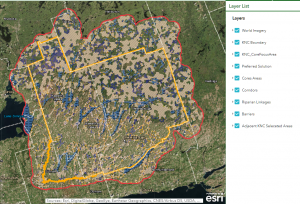
Click the image, to access the ArcGIS map
2. Use the ArcGIS online version: http://arcg.is/2e3IEO0 – This version provides user-friendly access through an interactive online viewer. You can turn various map layers ON or OFF, measure distances, mark locations, and choose from a variety of base map layers including aerial photos. We encourage individuals and groups to use this online version to zoom in and pan around specific areas of the map, and save a copy to share with others. Need technical help? Contact us.
3. Download the Google Earth KMZ files: http://www.kawarthasnaturally.ca/map-files/ (Google Earth is required – free download) – This version of the mapping is more sophisticated and provides spatial analysis capability: overlay the mapping layers onto updated aerial photographs, zoom in and pan around, draw polygons and lines, measure distances, and create customized maps that you can print and/or email. Each of these map files is identified by a file name and number (eg. Map Package 1 KNC Connectivity Components.kmz – 41 MB). Please note that the KMZ map files are quite large in size which will limit the number of files you can open simultaneously…
Tips for working with Google Earth KMZ files:
i. Review the instruction manual accessed via … http://www.kawarthasnaturally.ca/instructions-manual/
ii. Consult the following map titles, which correspond to the abbreviated file ID numbers and letters. (e.g. Map 2a= Connectivity Barrier Features). Hover over each entry below, for a more complete description of content and possible uses for each map.
4. ArcGIS file geodatabase version: http://bit.ly/2dNpTRm – (NOTE: Users must have access to an ArcGIS license to use this version of the map). This mapping provides full spatial analysis and editing capabilities, and is available through Land Information Ontario (LIO).
More about what you will find contained in the Phase 2 – Baseline Connectivity Mapping:
Consistent with the Natural Heritage Reference Manual, Second Edition, OMNR, 2010, the Significant Wildlife Habitat Technical Guide, OMNR, 2000 and input from wildlife and landscape ecology specialists, criteria were developed that allocated the areas identified under the KNC Preferred Scenario, into a connected system as follows:
1. KNC Boundary – to design a regional natural heritage system (NHS), the Project Study Area was defined using an ecological, not administrative, boundary. It includes a 5km buffer around the extent of all 33 tertiary watersheds within the City of Kawartha Lakes, County of Peterborough, and City of Peterborough.
2. Core Areas – considered the building blocks of an NHS, Core Areas should be capable of providing and sustaining ecological functions. They consist of the following four core area types
(a) Aquatic Core Areas – these include large lakes, ≥ 20 ha in size and river segments ≥ 60m wide.
(b) Terrestrial Core Areas – these include the least fragmented of the KNC selected areas that are at least 500 m wide.
(c) Core Area Enhancement Zones – these areas represent opportunities to expand and enhance the Terrestrial Core Areas through restoration, where KNC selected areas are more fragmented.
(d) Potential Core Areas – these areas represent opportunities to build entirely new Terrestrial Core Areas through restoration, where KNC selected areas are more fragmented.
3. Corridors – these areas connect or have the potential to connect, through restoration, terrestrial and/or aquatic Cores Areas together, utilizing as much of the KNC selected areas between Cores as stepping stones. They include the following three parts:
(a) Corridor Pathways – identify the shortest distance between Core Areas within Corridor Zones, while travelling through as much of the KNC selected areas as possible and avoiding the Barrier Features.
(b) Corridors – are 200m wide buffers delineated along Corridor Pathways and reflect the minimum recommended width necessary in order to support plant and animal movement between Core Areas.
(c) Corridor Zones – identify broader zones that connect Core Areas together where the KNC selected areas are most concentrated and within which the Corridor Pathways were mapped.
4. Riparian Linkages – these areas connect or have the potential to connect through restoration, terrestrial and/or aquatic Cores Areas together along riparian systems and may also serve as supporting connections between Corridors. They are 100m wide buffers delineated along Riparian Linkage Pathways that follow streams, creeks or rivers that connect Core Areas while avoiding Barrier Features.
5. Barriers – represent man-made features on the landscape that are considered impediments to plant and animal movement and consist of urban areas and subdivisions, rural homesteads and 400 series highways. Barrier Features are not included within any of the connectivity components delineated on this map.
6. Adjacent KNC Selected Areas – these consist of less fragmented KNC preferred scenario selected areas that are located within 100m of any of the other connectivity components described above.
NOTE: This mapping in no way represents decisions concerning land use or land use policy. In addition, it is essential that the boundaries delineated on this map be verified using the most recent ortho imagery available in conjunction with field visits and any adjustments made to boundaries as appropriate, in particular, prior to any policy and/or resource commitments that may be considered through the use of this map.
Prior to viewing and making use of the contents of this map package, it is important that the project report entitled The Kawarthas, Naturally Connected – A Natural Heritage System for the Kawartha Lakes Region, Phase 1 Project Report, 2013 be carefully reviewed.
The objective of this mapping is to delineate areas that connect (or through restoration, have the potential to connect) the areas selected under the KNC Preferred Scenario. Consistent with the Natural Heritage Reference Manual, Second Edition, OMNR, 2010, the Significant Wildlife Habitat Technical Guide, OMNR, 2000 and input from wildlife and landscape ecology specialists, criteria were developed that allocated the areas identified under the KNC Preferred Scenario, into a connected system of:
- Aquatic Cores – consist of large lakes, greater than 20 ha in size or river segments wider than 60 m.
- Terrestrial Core Areas – these include the least fragmented of the KNC selected areas that are at least 500 m wide.
- Terrestrial Core Area Enhancement Zones – these areas represent opportunities to expand and enhance the Core Areas through restoration, where KNC selected areas are more fragmented.
- Potential Terrestrial Core Areas – these areas represent opportunities to build entirely new Core Areas through restoration, where KNC selected areas are more fragmented.
- Corridors (Primary and Alternate) – these areas connect or have the potential to connect, through restoration, terrestrial and/or aquatic Cores Areas together, utilizing as much of the KNC selected areas between Cores as stepping stones.
- Riparian Linkages – these areas connect or have the potential to connect throughchange restoration, terrestrial and/or aquatic Cores Areas together along riparian systems and may also serve as supporting connections between Corridors.
- Adjacent Selected Areas – these consist of less fragmented KNC selected areas that are located within 100m of any of the other connectivity components described above.
This mapping is provided as a reference to facilitate and support subsequent analysis, mapping and reporting needs in order to inform decisions regarding, for example;
- the identification of strategic restoration and stewardship opportunities
- land use planning and policy development
- priorities for conservation land acquisitions
- development proposal impact assessments
- climate change adaptation strategies.
This mapping in no way represents decisions concerning land use or land use policy. In addition, it is essential that the boundaries delineated on this map be verified using the most recent orthoimagery available in conjunction with field visits and any adjustments made to boundaries as appropriate, in particular, prior to any policy and/or resource commitments that may be considered through the use of this map.
This map was used in order to produce Map 1 – KNC Connectivity Components.
Urban and rural residential footprints represent barriers to connectivity and were excluded from all connectivity components (i.e. cores, corridors, riparian linkages and adjacent areas) based on the assumption that these areas preclude opportunities for restoration, provide poor habitat and are generally avoided by a broad range of wildlife species. 400 series highways were excluded from core areas and adjacent areas of natural cover, however, corridors and riparian linkages were delineated across highways in an effort to locate opportunities where mitigation measures (e.g. wildlife over passes, under passes) might best be implemented to make 400 series highways more permeable to wildlife movement.
This map was used in order to produce Map 1 – KNC Connectivity Components.
Lakes and rivers from this map were used to identify cores, corridors, riparian linkages and adjacent areas. Creeks and streams from this map were combined with lakes and rivers to identify riparian linkages.
This map was used in order to produce Map 1 – KNC Connectivity Components.
Corridors Zones connect Terrestrial Cores to other Terrestrial Cores or Terrestrial Cores to Aquatic Cores and were delineated in areas where the Preferred Scenario Selected Areas acted as stepping stones between Core Areas. Corridor Pathways show the route within Corridor Zones that connect Core Areas together while travelling through as much of the KNC Preferred Scenario Selected Areas as possible over the shortest distance and were used to delineate the Corridors in Map 1. Linkage Pathways show where along streams or river and lake shorelines, Core Areas and/or Corridors are connected and were used to delineate the Riparian Linkages in Map 1.
This map was used in order to produce Map 1 – KNC Connectivity Components.
This map shows the areas chosen by the Kawarthas Naturally Connected (KNC) Scenario Planning Team. The abundance and distribution of these areas determined the location of Cores, Corridors, Riparian Linkages and Adjacent Areas.
The majority of natural heritage features that were identified, mapped and targeted for inclusion within the KNC Preferred Scenario were based on these areas of natural cover. Open Upland Vegetation Communities occur on dry sites with little to no tree cover, consisting of:
- bluffs,
- sand barrens and dunes,
- tallgrass prairies,
- tallgrass savannahs and
- tallgrass woodlands
The majority of natural heritage features that were identified, mapped and targeted for inclusion within the KNC Preferred Scenario were based on these areas of natural cover. Upland Forests occur on moist to dry soils with dense tree cover consisting of deciduous, coniferous and mixed species stands including coniferous plantations.
The majority of natural heritage features that were identified, mapped and targeted for inclusion within the KNC Preferred Scenario were based on these areas of natural cover. Lowland Forests or Swamps, are found on wet to very wet soils with dense tree cover consisting of deciduous, coniferous and mixed species stands.
The majority of natural heritage features that were identified, mapped and targeted for inclusion within the KNC Preferred Scenario were based on these areas of natural cover. Open Wetlands occur on very wet soils with little to no tree cover or in shallow aquatic areas and consist of:
- open swamps
- fens
- bogs and
- marshes
The majority of natural heritage features that were identified, mapped and targeted for inclusion within the KNC Preferred Scenario were based on these areas of natural cover. Hedge Rows consist of narrow, 10 to 30m wide, linear areas with dense tree cover that typically separate agricultural fields.